Ask any question about your supply chain. Get an answer grounded in {{years}} years of intelligence.
A natural-language interface to the FourKites Graph. You ask a question the way you would ask your best analyst. FourSight answers with data, visualizations, and actionable recommendations in seconds, drawing on intelligence no analyst could assemble manually.

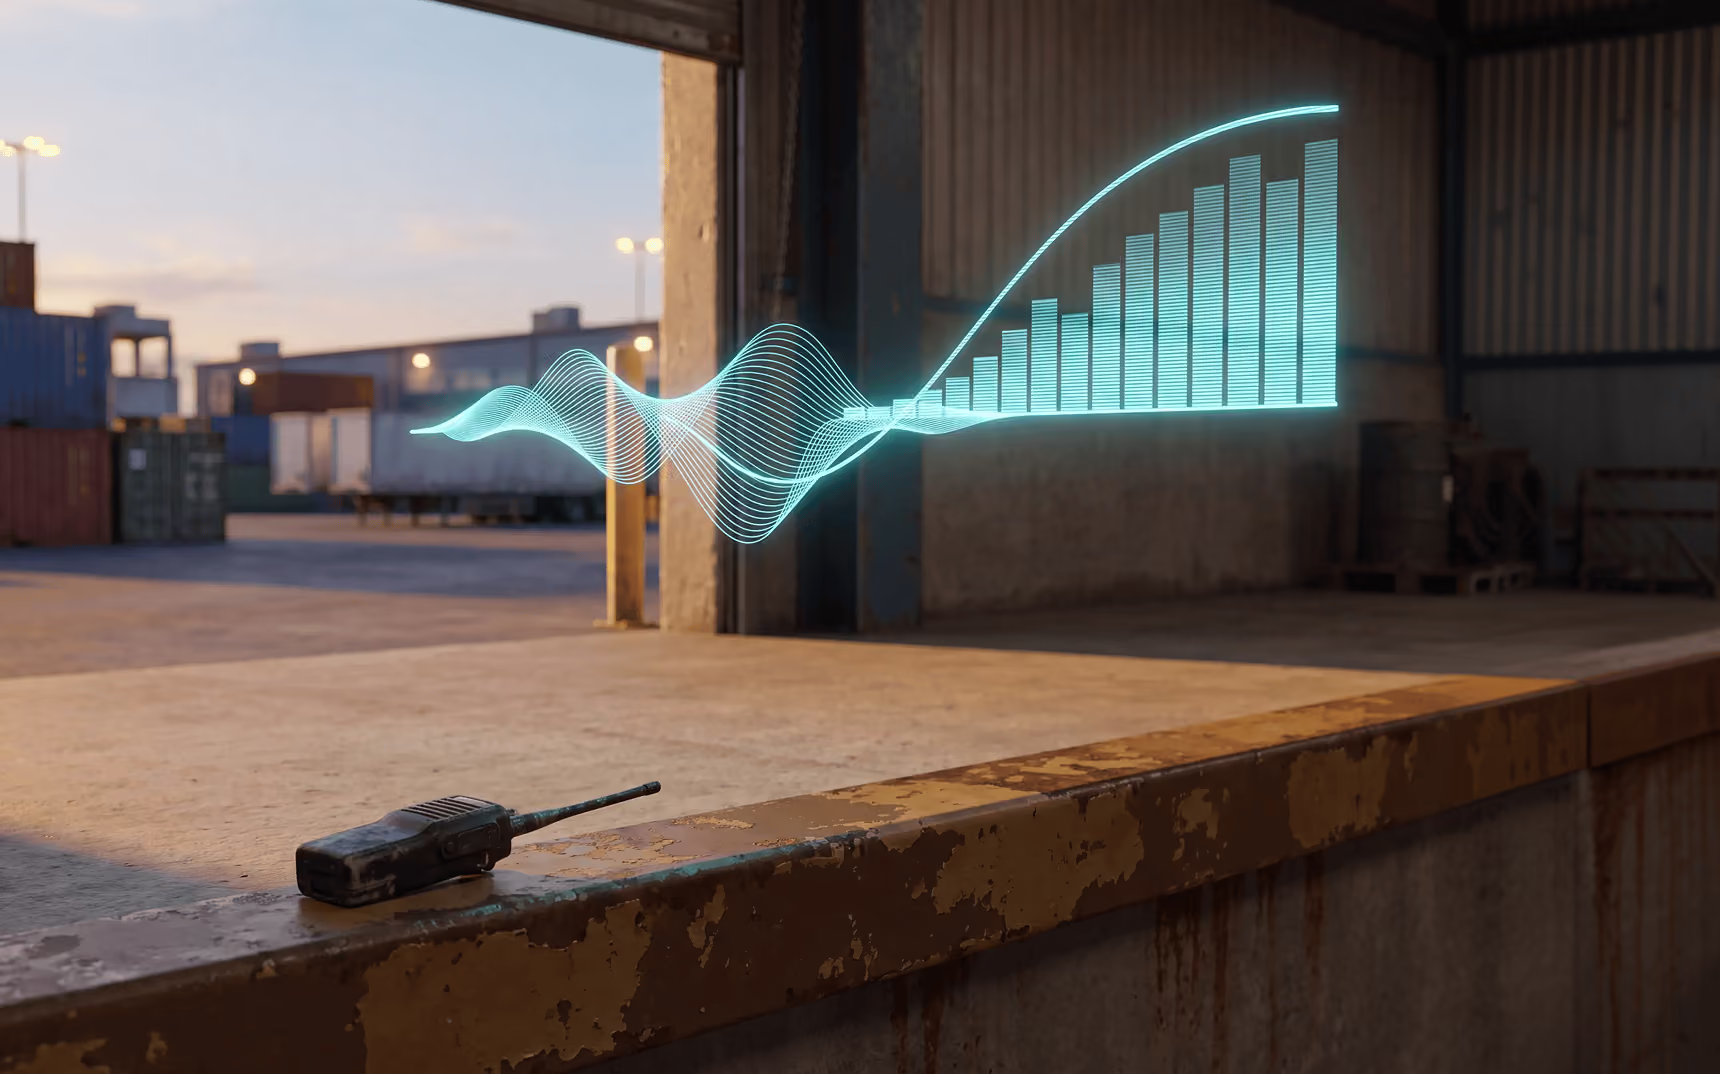
Plain language in.
Graph-grounded intelligence out.
You type or speak a question. FourSight interprets intent, queries the Graph and Digital Twins, assembles the answer from multiple sources, and returns a response with data, visualizations, and narrative context. Generated in real time from live data.





FourSight maintains context across follow-ups. 'Which carriers had the worst on-time rate?' Then: 'Just the top 5 by volume.' Then: 'Break down Carrier X by lane.' Then: 'Weather attribution on those delays?' Each question builds on the prior context. 40% of real FourSight conversations are multi-turn.
The Bridge to Action
See a pattern. Create a workflow. Fix it permanently. 'Create a monitoring workflow for this carrier.' Sophie builds an AOP. Tracy starts watching. The pattern you discovered in conversation becomes an automated outcome running 24/7. Discovery to decision to execution, without leaving the platform.
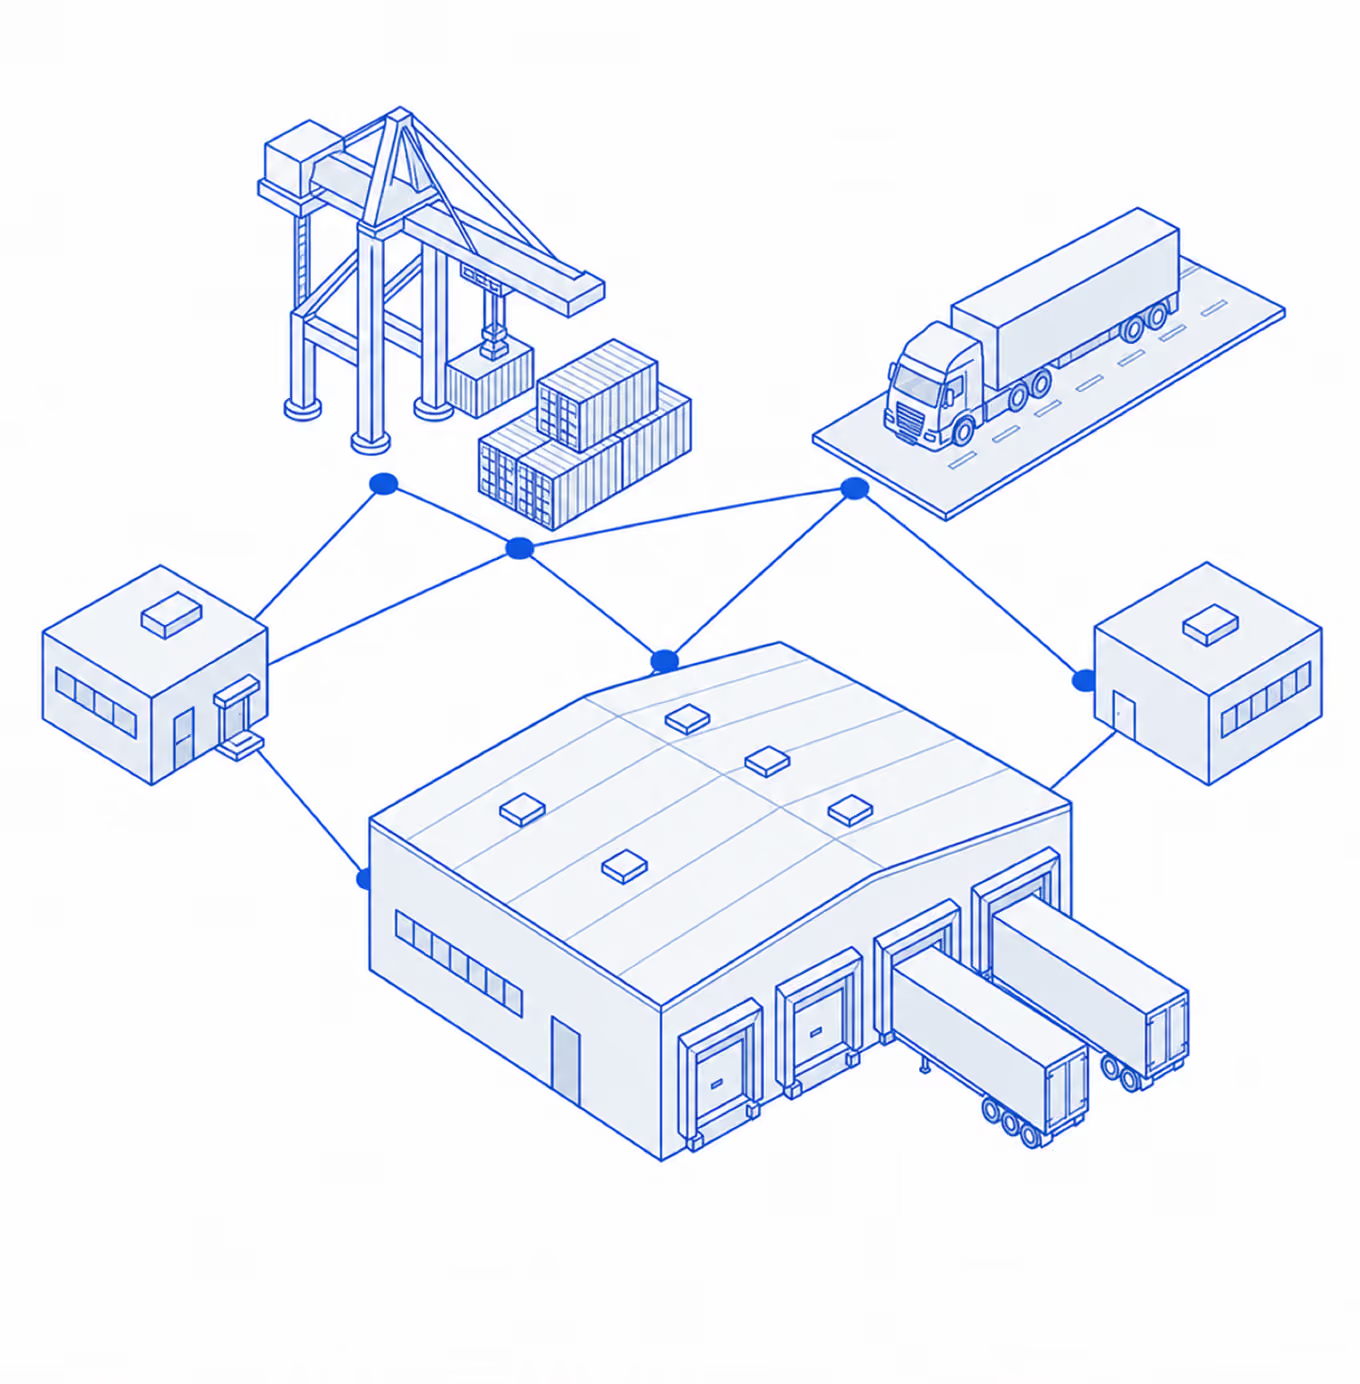
Grounded in the FourKites Graph
Any BI tool can answer questions about your data. Only FourSight answers questions about the network.
'What is my average dwell time at Memphis?' A BI tool says: 4.2 hours. FourSight says: 4.2 hours, 72nd percentile for food and beverage DCs of similar volume. Network median is 2.8 hours. 61% of excess dwell occurs 6-9 AM. Facilities that adjusted receiving labor to match actual arrival patterns reduced dwell by 31%.
Same question. Fundamentally different answer. The difference is the Graph.
'What is my average dwell time at Memphis?' A BI tool says: 4.2 hours. FourSight says: 4.2 hours, 72nd percentile for food and beverage DCs of similar volume. Network median is 2.8 hours. 61% of excess dwell occurs 6-9 AM. Facilities that adjusted receiving labor to match actual arrival patterns reduced dwell by 31%.
Same question. Fundamentally different answer. The difference is the Graph.
Average time to first value: Minutes, not months.
The Graph generates the experience..
Zero
Configuration cost
Zero
Maintenance cost
Zero
Staleness

"We want to be able to provide back to the organization things like predictive analytics, network design and optimization based on a digital twin. All of the data that we're collecting from FourKites is helping us reach that ultimate goal."
Every person sees what they need. No dashboards to build.
The Graph generates the experience.
Ready? Talk to an Outcome Advisor